

The Scoreboard Doesn’t Lie:
The Long-Term Case for Index Funds
Written By: Nick Ziarek, CFP®, CFA®

Twice a year, S&P Dow Jones Indices publishes a report card called the SPIVA (S&P Indices Versus Active) Scorecard. It asks a simple question: Do professional fund managers, who pick stocks for a living, actually beat the market? The mid-year 2026 edition, with data through June 30, gives the same answer it has given for more than two decades: mostly, no.
The Basics
An index fund doesn’t try to be clever. It buys every stock in a benchmark like the S&P 500, which tracks the 500 largest publicly traded U.S. companies. An actively managed fund is run by a portfolio manager and team of analysts who pick which stocks to buy and sell, hoping to outperform the index. SPIVA compares the two approaches, using fund returns measured after fees.
Conditions Were Ripe for Stock Pickers, Yet Most Still Lost
On paper, the first half of 2026 was ideal for active managers. A war in the Middle East rattled markets early in the year, then stocks roared back, leaving the S&P 500 up about 10%. Small-cap companies did even better. The gap between winning and losing stocks was the widest since 2008, while the tech-heavy Mag 7 companies shrank as a percentage of the index. In theory, that is exactly when skilled stock pickers should shine.
Yet 67% of large-cap funds still trailed the S&P 500. Among mid-cap funds, 74% fell short, and among small-cap funds, 69% did. The report’s authors concluded that beating the market remains elusive in every kind of market.
The Longer You Go Back, The Worse It Gets
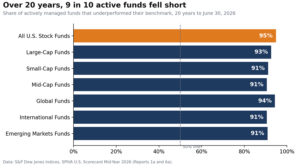
One disappointing stretch could be bad luck, but the long-term numbers tell the real story. Over the past 20 years:
- About 93% of large-cap funds underperformed the S&P 500
- About 91% of mid-cap and small-cap funds lagged their benchmarks
- Nearly 95% of all U.S. stock funds fell short
The pattern holds overseas as well. More than 90% of global, international and emerging-markets funds trailed their benchmarks over 20 years.

The Funds that Quietly Disappear
SPIVA also counts funds that closed or merged along the way, which usually happens after poor performance. Of the U.S. stock funds that existed 20 years ago, only about 38% still exist today. Fund marketing tends to show only the survivors, which makes active management look better than it really is.
What the Gap Means in Dollars
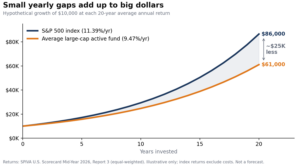
Over 20 years, the average large-cap fund returned 9.47% per year, compared with 11.39% for the S&P 500. Two percentage points sounds small, but compounding makes it large. In a hypothetical example, $10,000 growing at the index’s rate would become about $86,000 over 20 years. At the average fund’s rate, it would become about $61,000. That is roughly $25,000 less from a single investment. Index returns don’t include costs, but low-cost index funds charge far less than that gap.

Why is Beating the Market so Hard?
The report points to how quickly markets change direction. In 2026, market leadership flipped several times: energy stocks led early on, tech stocks took over, and small caps moved in and out of favor. Even when conditions looked promising, those swings made gains hard to capture. Active managers also carry management fees and trading costs, so they start day one a few steps behind the index.
Fixed income is a partial bright spot though. In early 2026, only 38% of bond funds underperformed on average. Over 20 years, though, most bond categories still trailed their benchmarks.
The Takeaway
You don’t need to find a hot shot fund manager or predict the next big thing. For most investors, simply owning the whole market at a low cost has beaten the majority of professionals over time. The market is hard to beat, and the SPIVA Scorecard keeps showing it.
Source: S&P Dow Jones Indices, SPIVA U.S. Scorecard Mid-Year 2026