
Shakespeare Blog: View from the Lake

A Year in Review: Economic Updates from 2022
Written By: Nick Ziarek, CFP®, CFA

As 2022 comes to a close, we look back on what was a rocky year by many measures. From market returns to inflation and interest rates to crypto markets, there seemed to be no safe haven. Throw in a dose of geopolitical unrest in Russia/Ukraine and abroad and it seemed there was always a reason for markets to go lower.
Inflation
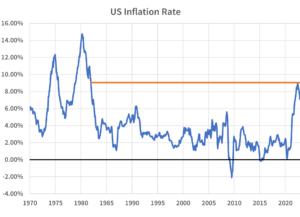
The year started off with a sense of concern over inflation, which was nearing a four decade high of 7%. Despite that, the Federal Reserve was still describing it as transitory and through their regular forecasting surveys were targeting a 1% Fed Funds rate at the end of 2022. Inflation would not slow down though, fueled further by the Russia/Ukraine crisis and a spike in energy prices. It would peak just north of 9% in June.
Interest Rates
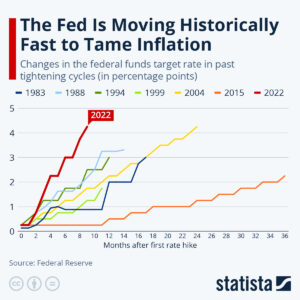
During this time, the Fed had to aggressively change its tone and actions to combat inflation. The first rate increase since November 2018 was for 25bps (0.25%) in March, followed by 50bps in May, and then an unprecedented four straight increases of 75bps before the Fed slowed the rate of increase to 50bps at their December meeting. By the end of the year the Fed Funds rate would stand at 4.25%. For comparison purposes, the Fed increased interest rates 425bps between 2002 and 2004, but that was over the course of two years compared to just nine months this time. The speed and magnitude at which the Fed is targeting inflation is the fastest on record.
Market Review
As the Fed pivoted, markets began to adjust to the new normal of higher rates. Gone were the days of free and easy money and unchecked optimism. This adjustment lead to a repricing of risk. Not just in bond prices or lending standards, but also in expectations for growth and earnings of individual companies. The price-to-earnings ratio (P/E) of the S&P 500 – a gauge of how much investors are willing to pay for each dollar of earnings – fell from 21x to 15x all while earnings actually grew during the year. This means investors are putting less value on earnings over a fear they will not continue growing at their recent pace or may even decline.
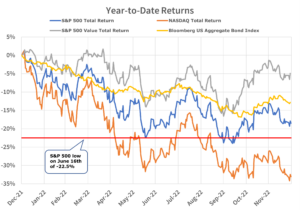
The repricing of risk was swift and unbiased, with the S&P 500 essentially bottoming out in June, down 22.5% at the time. The tech and growth heavy NASDAQ was down 31.7% over the same time period. The NASDAQ had annual returns of 36%, 44% and 22% over the past three years.
Even the traditional safety of fixed income was negated by the rapid rise in interest rates, with bonds posting their worst start to a year ever, down more than 12.5% in the first six months.
There were some bright spots though as value stocks, while down, significantly outperformed their growth counterparts with returns of -4.9% and -29.3% respectively. The once hot FAANG stocks of Facebook (Meta), Apple, Amazon, Netflix and Google (Alphabet) are down on average 46% from their peaks lead by Facebook down a staggering 64.7% and Amazon down 50% for the year.
Crypto
As mentioned earlier, when free and easy money dries up many ideas which initially sounded good start to be exposed for their weaknesses and reality they present. This is nowhere more front and center than in the crypto sector. Many currencies crashed or failed during the year, lead by Bitcoin which fell 64%, the total failure of the Terra Luna coin which fell 99% in a few hours in March, and more recently the bankruptcy and likely pure Ponzi scheme of FTX and Sam Bankman Fried. It became evident that this nascent sector of the economy is still the wild wild west, rampant with nefarious characters out for their own good. Regulation would protect the individual investor but the whole crux of the sector is decentralized finance (DeFi) outside of regulation. Warren Buffet said it best: “Only when the tide goes out do you discover who’s been swimming naked.”
Outlook for 2023
All is not gloom and doom – markets are forward-looking. With the Fed expected to be nearing the end of their tightening cycle, and the most anticipated recession in history expected to be announced in 2023, markets have absorbed the news and can start to look forward to how long and deep a recession may be and what it will look like when the economy comes out of it.
Since the bottom of the S&P 500 in mid-June (shown by the red line in the Year-to-Date Return chart above) markets are generally up. Over the last six months, the S&P 500 is up roughly 5%, value stocks up 10%, the NASDAQ is down only 2%, and fixed income is down a much more manageable 1.3%.
The market P/E is now below the 25-year average, suggesting stocks are starting to look cheap compared to historical levels. Inflation has ticked down from 9.06% to 7.11%, while previous headline grabbers such as gas prices are down 37%, used car prices down 19%, global shipping rates down 81%, and fertilizer down 45%, all from their peaks in 2022. Maybe most importantly is the close correlation between fertilizer prices and food prices. Lumber is down over 78% from its peak in May 2021, and mortgage rates have recently cooled off from a peak of 7% earlier this year.
Headlines will continue to focus on the negative since fear sells, but a lot of the bad news has already been absorbed by the markets this year and priced in. If you are working with an advisor at Shakespeare, we have put in the time to develop a solid financial plan so you can weather the current environment. At the same, regular and active portfolio monitoring and rebalancing will position you for the eventual turnaround.